24/7 フラッシュニュース
もっと >今日 2025-08-21
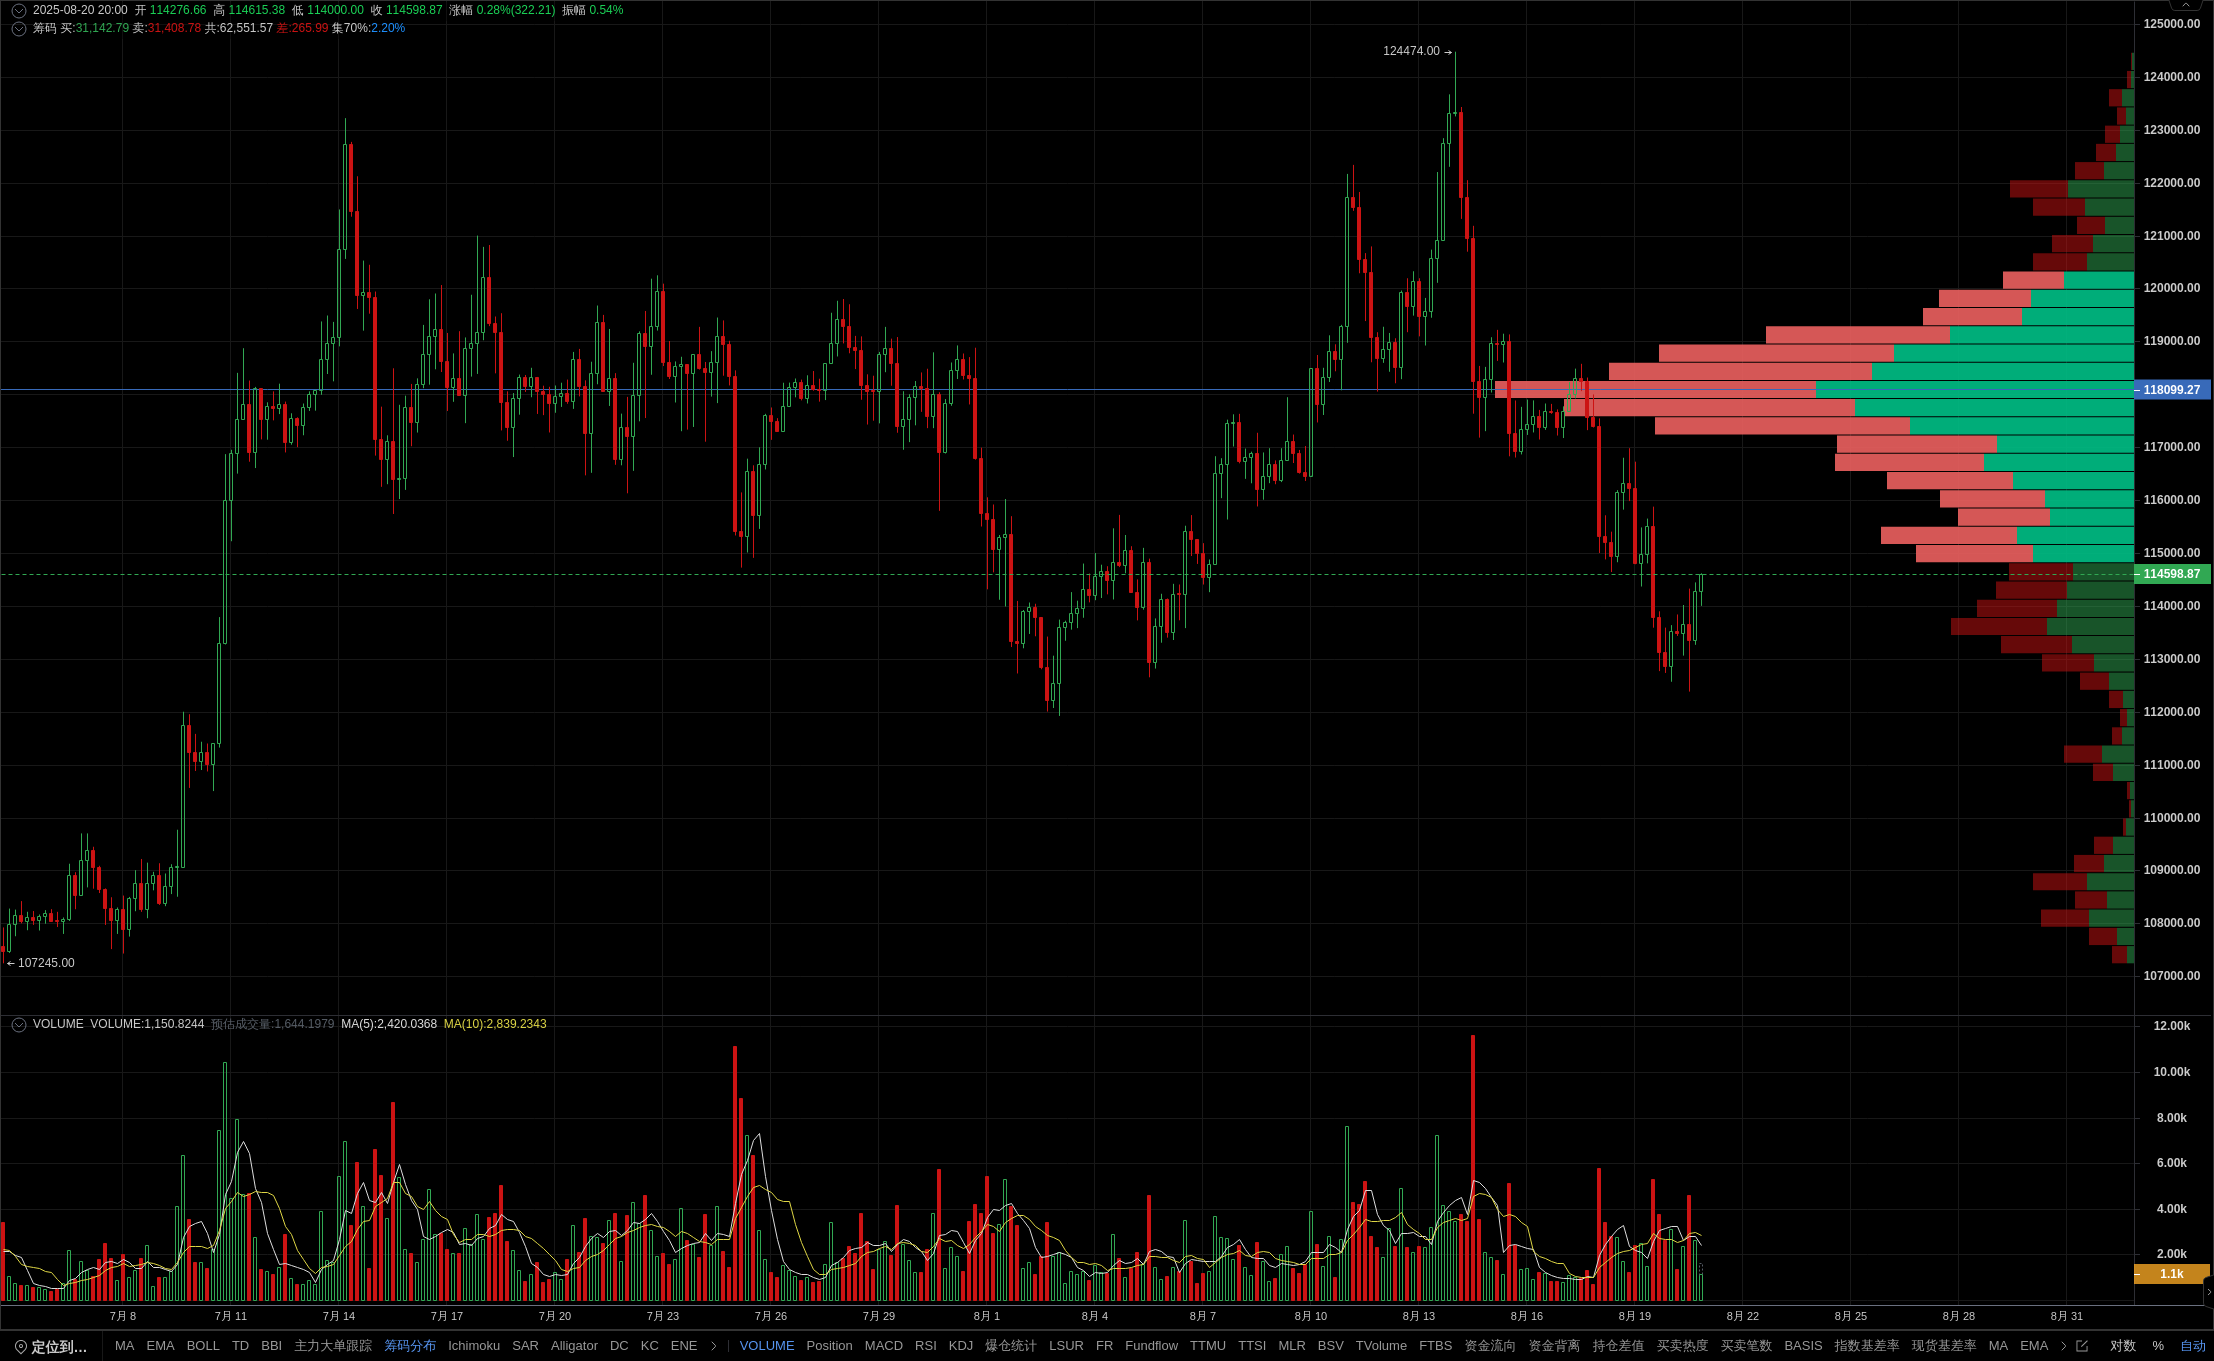
The current 4-hour cycle K-line shows that the price is below the EMA24 and EMA52 moving averages, indicating a weak overall trend. But with the divergence of MACD golden cross and KDJ indicator, the upward momentum has increased, and there may be a short-term rebound opportunity. The distribution of chips shows that the area from 118789 to 119031 is a strong resistance zone, with concentrated trading volume and dominant buying power. If it can break through, it will open up upward space. The current price is hovering around the support of 114000, and RSI has broken through the upward trend line, further verifying the bullish signal. Pay attention to whether the rebound can break through the psychological barrier of 115000. Indicator recommendation: Unlock membership function, accurately capture high and low points, and plan trading opportunities in advance! The data is sourced from the PRO member's [BTC/USDT Binance 4-hour] candlestick chart, for reference only, and does not constitute any investment advice.