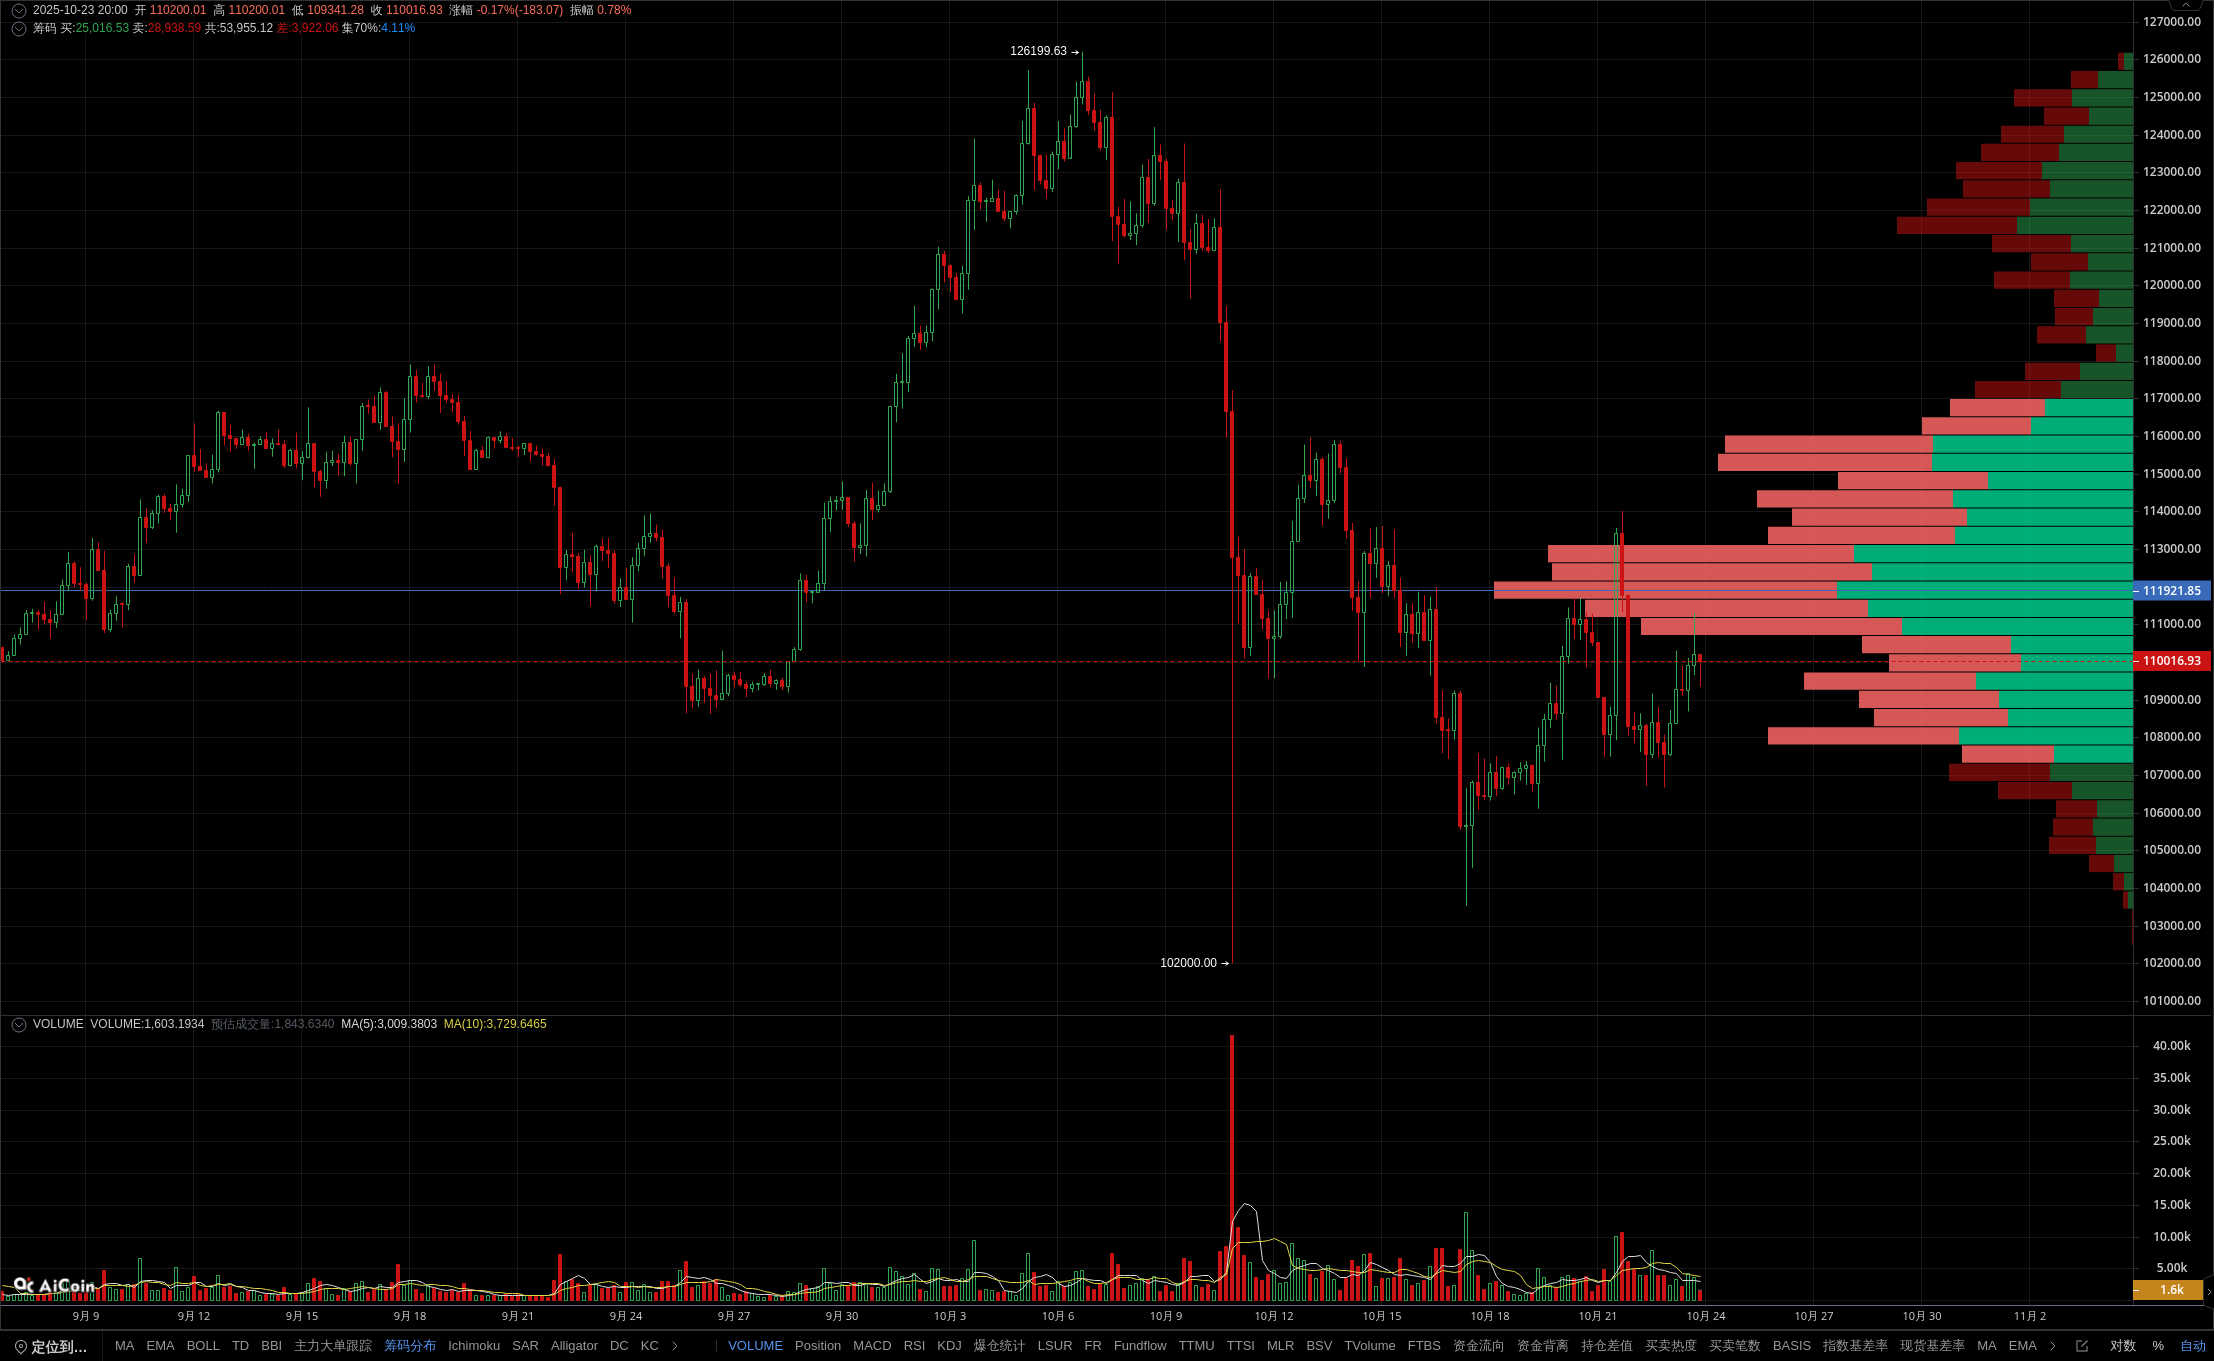
Key short-term direction selection for BTC: chip intensive areas and top split signals
Currently, BTC is testing the strong support zone of 108005-108253 in a 4-hour cycle, which is the area with the highest trading volume for chips and is dominated by buying. However, the latest K-line has formed a top pattern, suggesting the possibility of a local peak. Combined with the RSI falling below the 50 median line, the upward movement can be weakened, and caution should be exercised against the risk of losing support. Although MACD shows a bar chart growth, EMA24 crosses EMA52 to form a dead cross, indicating a bearish trend in the medium to long term. If the support level falls below or triggers further downward movement. It is recommended to pay attention to the gains and losses of the 108000 line, and if it falls below, it will bottom out at 107400. Indicator recommendation: Member exclusive chip distribution helps you accurately lock in support resistance and seize trading opportunities quickly! The data is sourced from the PRO member's [BTC/USDT Binance 4-hour] candlestick chart, for reference only, and does not constitute any investment advice.