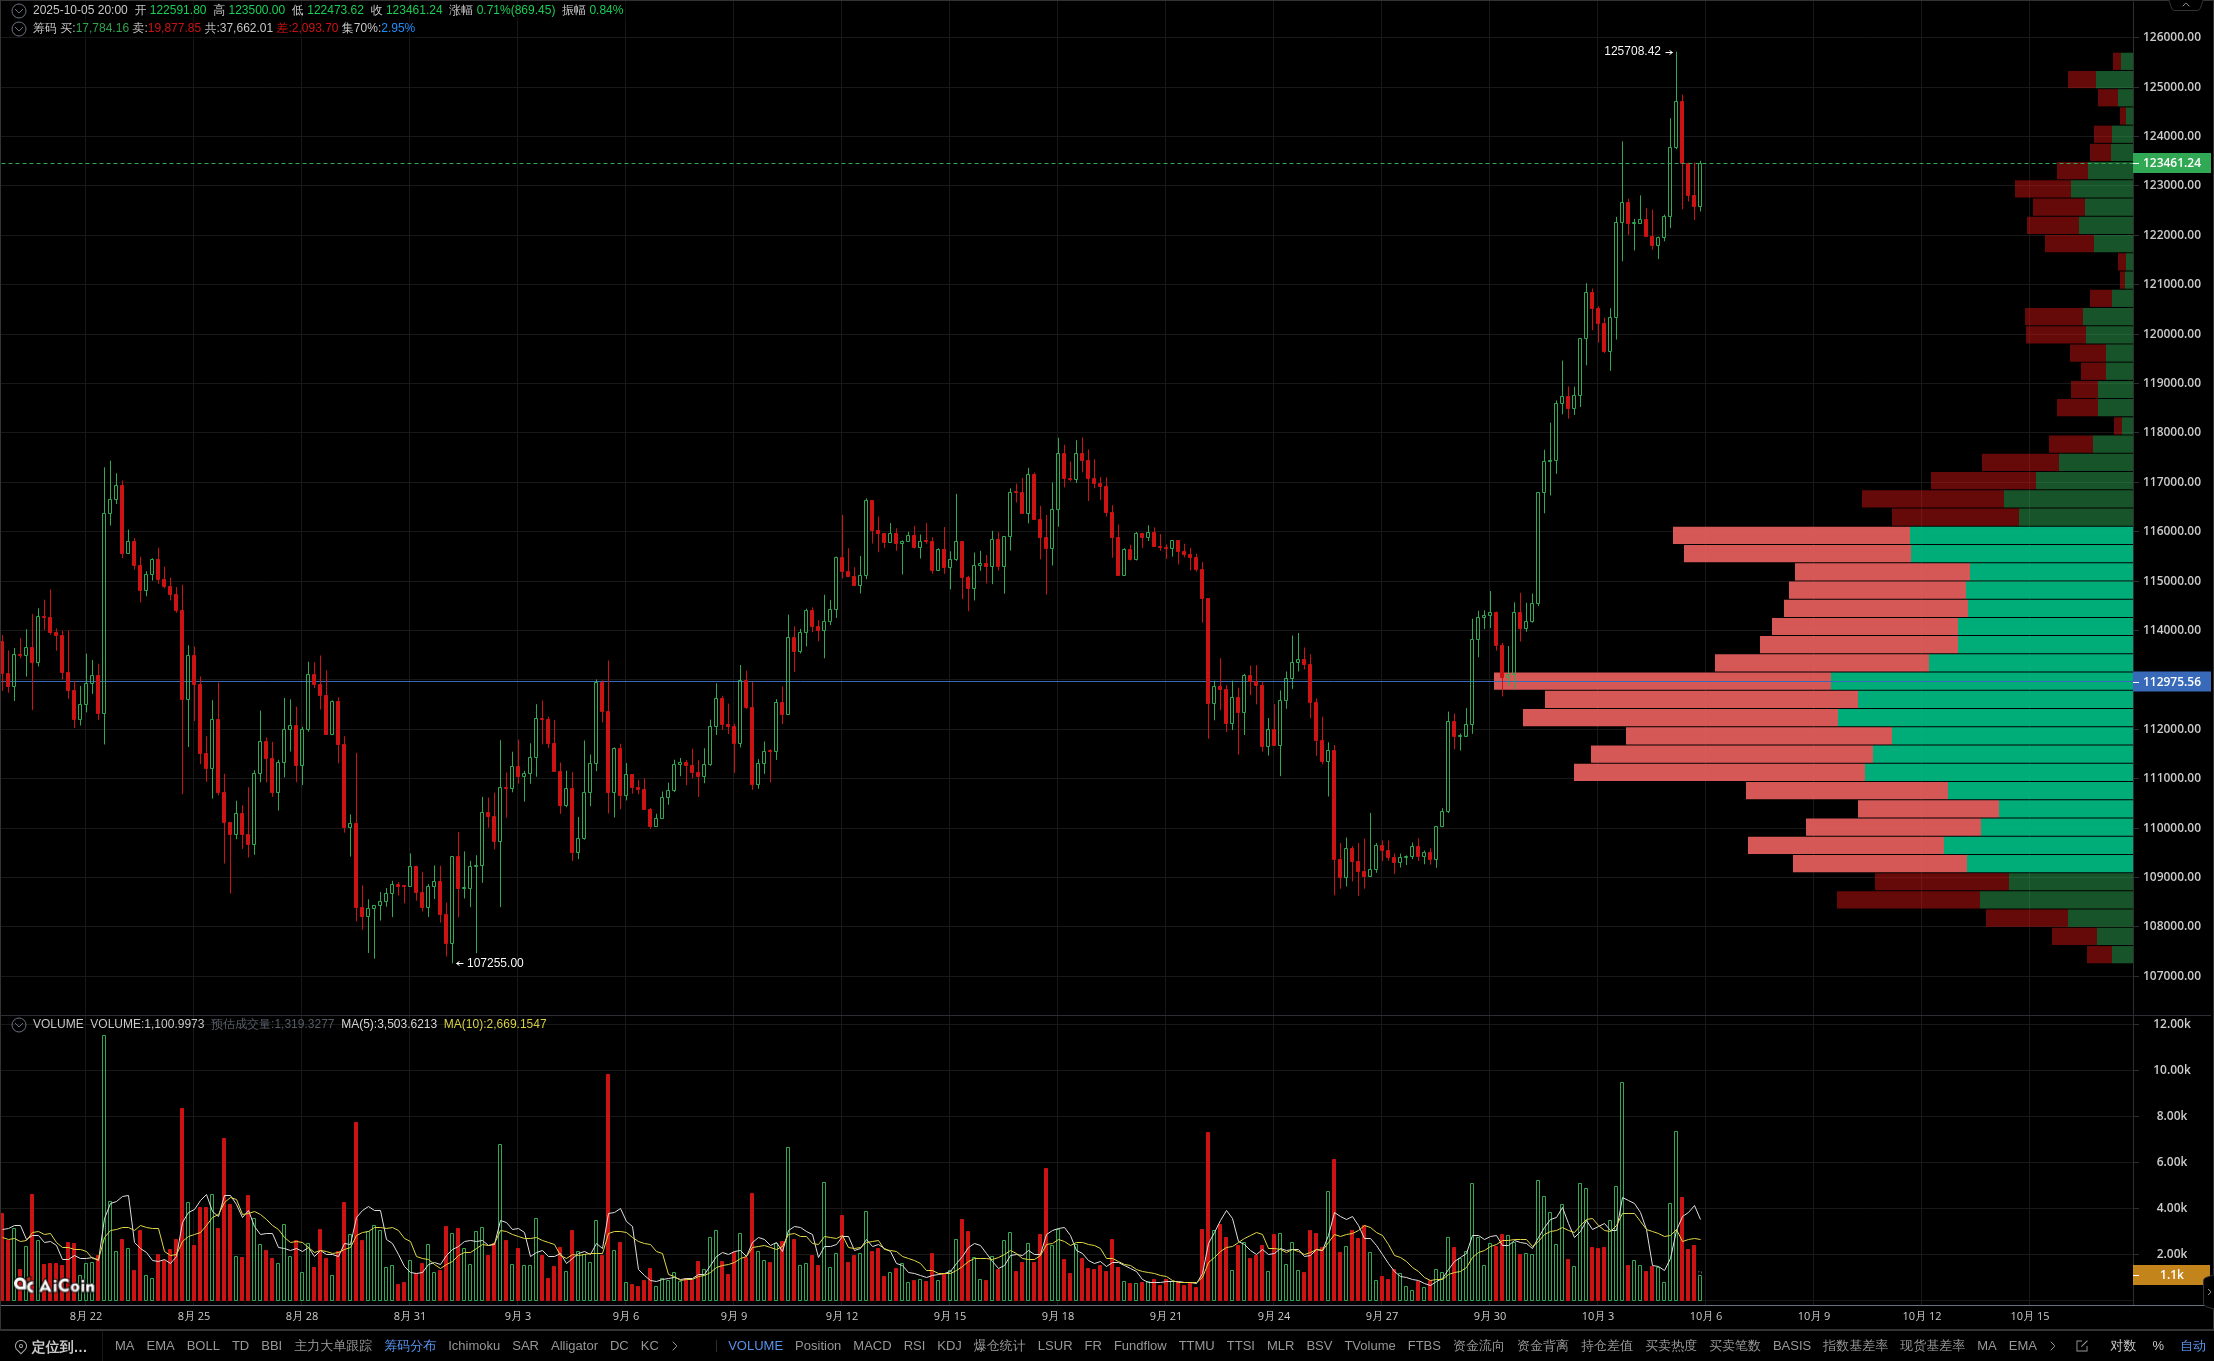
BTC key resistance level revealed: flat top shape implies pullback risk
The 4-hour cycle K-line shows that BTC prices are above the EMA24/52 moving average, indicating a strong overall trend. However, there is currently a flat top pattern, and the MACD bar chart continues to shrink, increasing downward momentum. The distribution index of exclusive chips for members reveals significant support near 109474, while there is no obvious resistance zone above, suggesting that the price may fall under pressure around 123500. The trading volume has shrunk to 46.38% of the recent average, and market interest has weakened, further verifying the probability of a pullback. If it falls below the EMA24 support level, or tests the strong support level of 109474. The membership function accurately locks in support resistance and provides early insight into the main trends! Open membership immediately and seize more profit opportunities. The data is sourced from the PRO member's [BTC/USDT Binance 4-hour] candlestick chart, for reference only, and does not constitute any investment advice.