ETH Short term Direction Decision: Key Support Levels Become Winning Hands
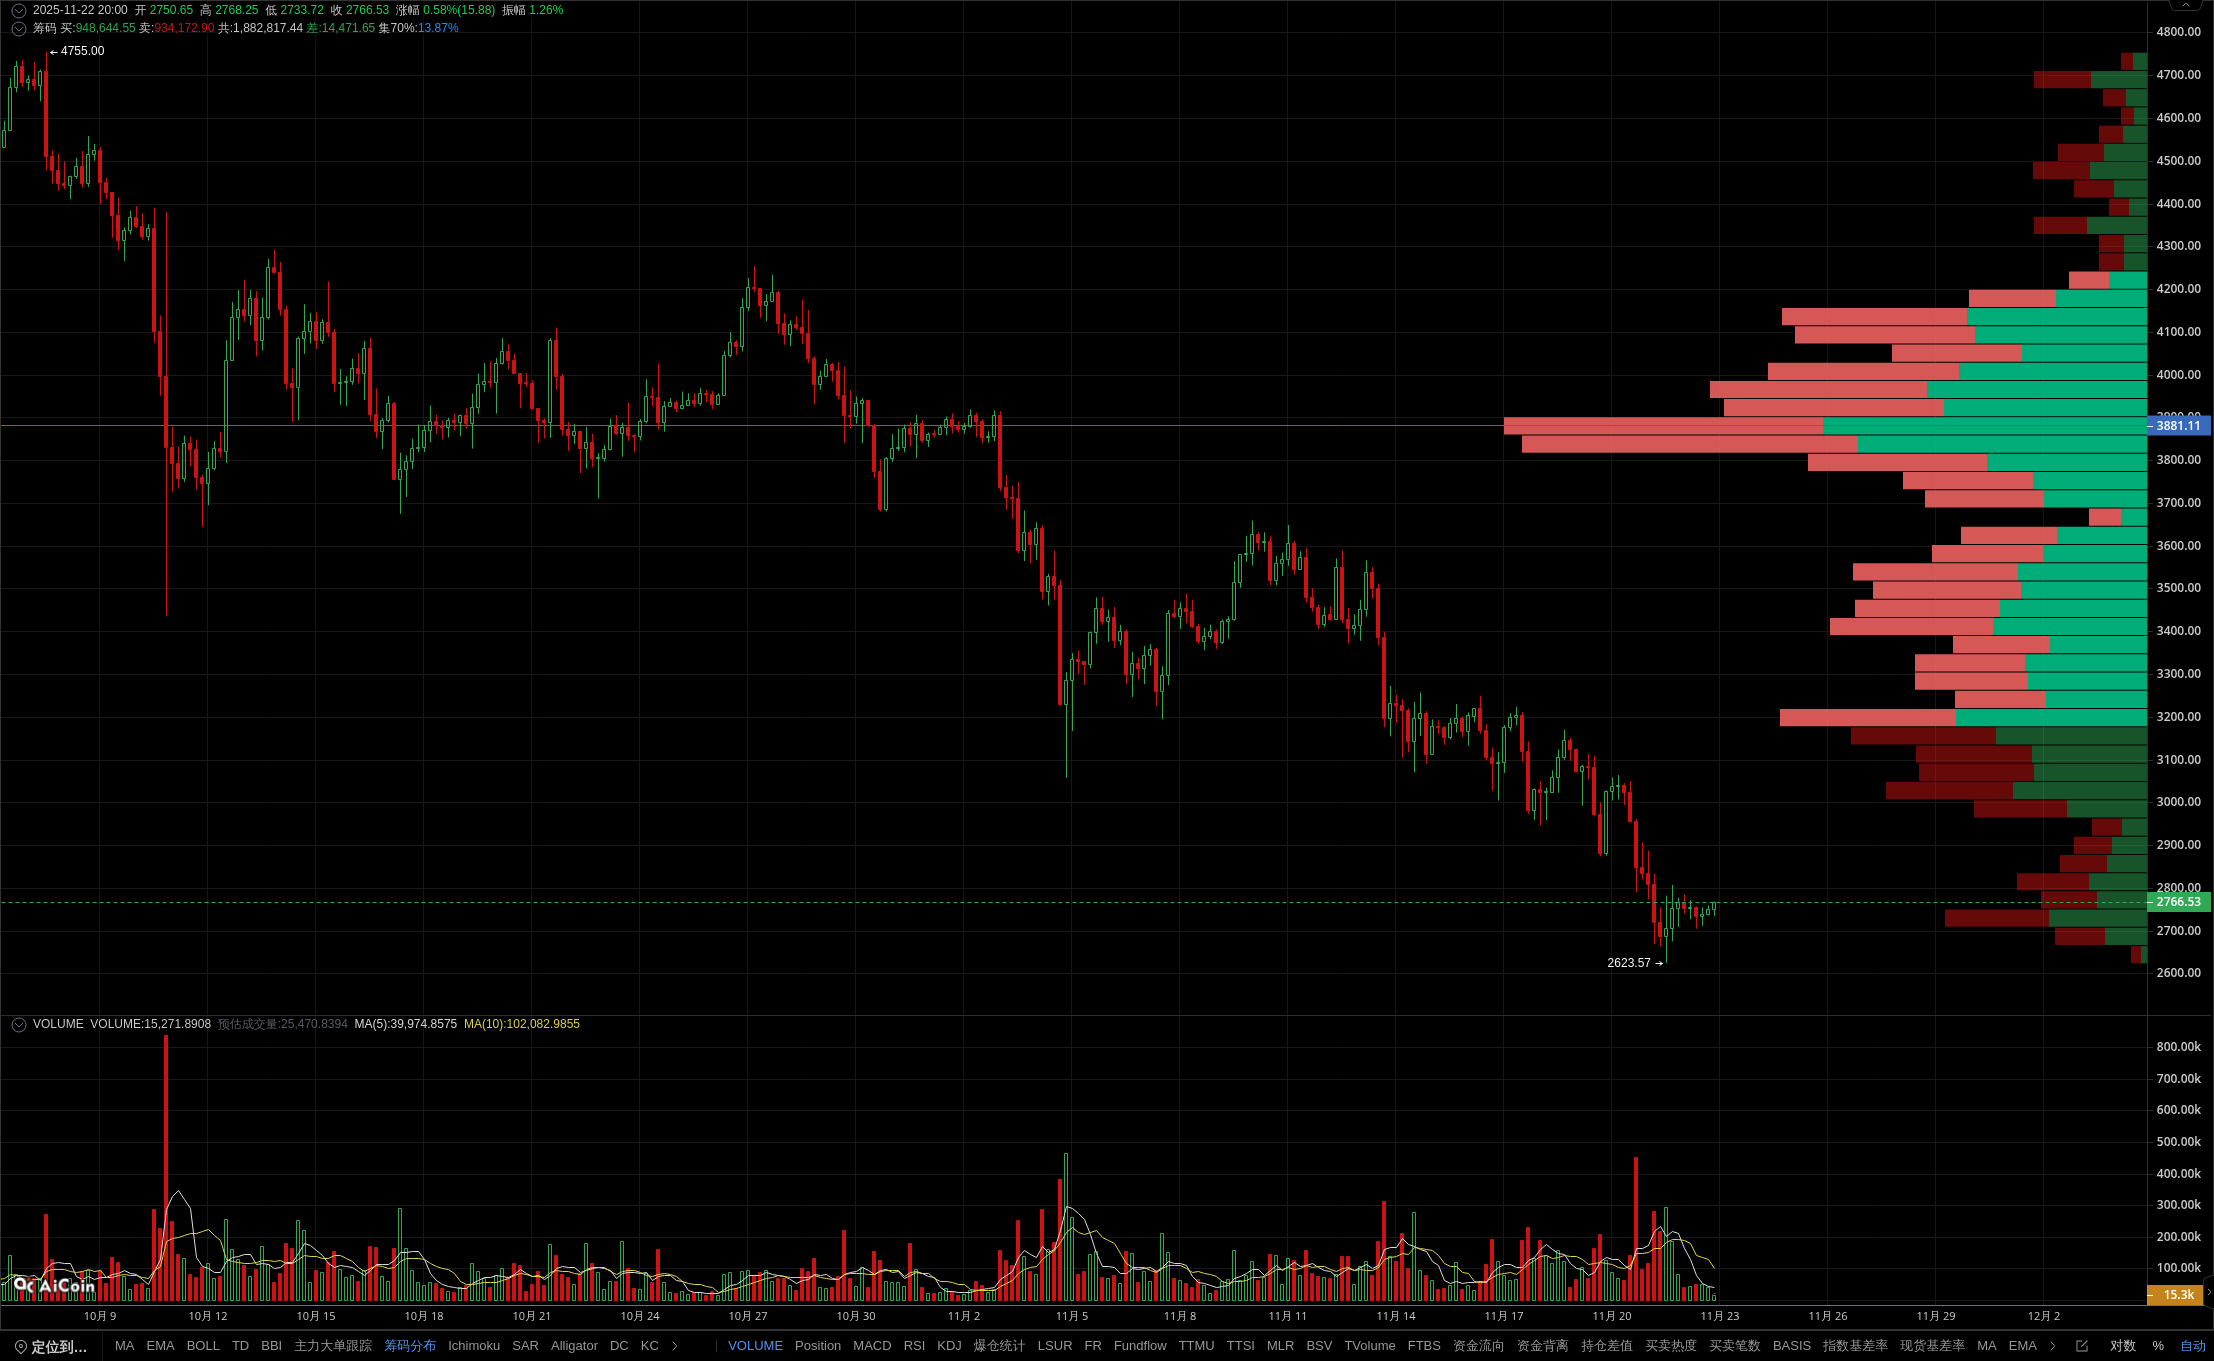
Member indicators show that the current ETH price is below the EMA24 and EMA52 moving averages, and the slopes of both moving averages are downward, indicating a weak mid to long term trend. Based on the distribution of chips, the area around 2729.5 USDT is a strong support zone, but the recent trading volume has shrunk to 22.88% of the average level, indicating low market buying interest. If it falls below the support level, it may accelerate the downward trend. On the candlestick chart, the latest 4-hour cycle has shown an upper hanging line, indicating insufficient short-term upward momentum, coupled with weak MACD golden cross signals, and caution against false breakthroughs. The area above 3173 USDT is a strong resistance zone, making it difficult to break through. Open a membership, receive real-time buying and selling point alerts, and accurately capture trend changes! The data is sourced from the PRO member's [ETH/USDT Binance 4-hour] K-line, for reference only, and does not constitute any investment advice.