Loading...
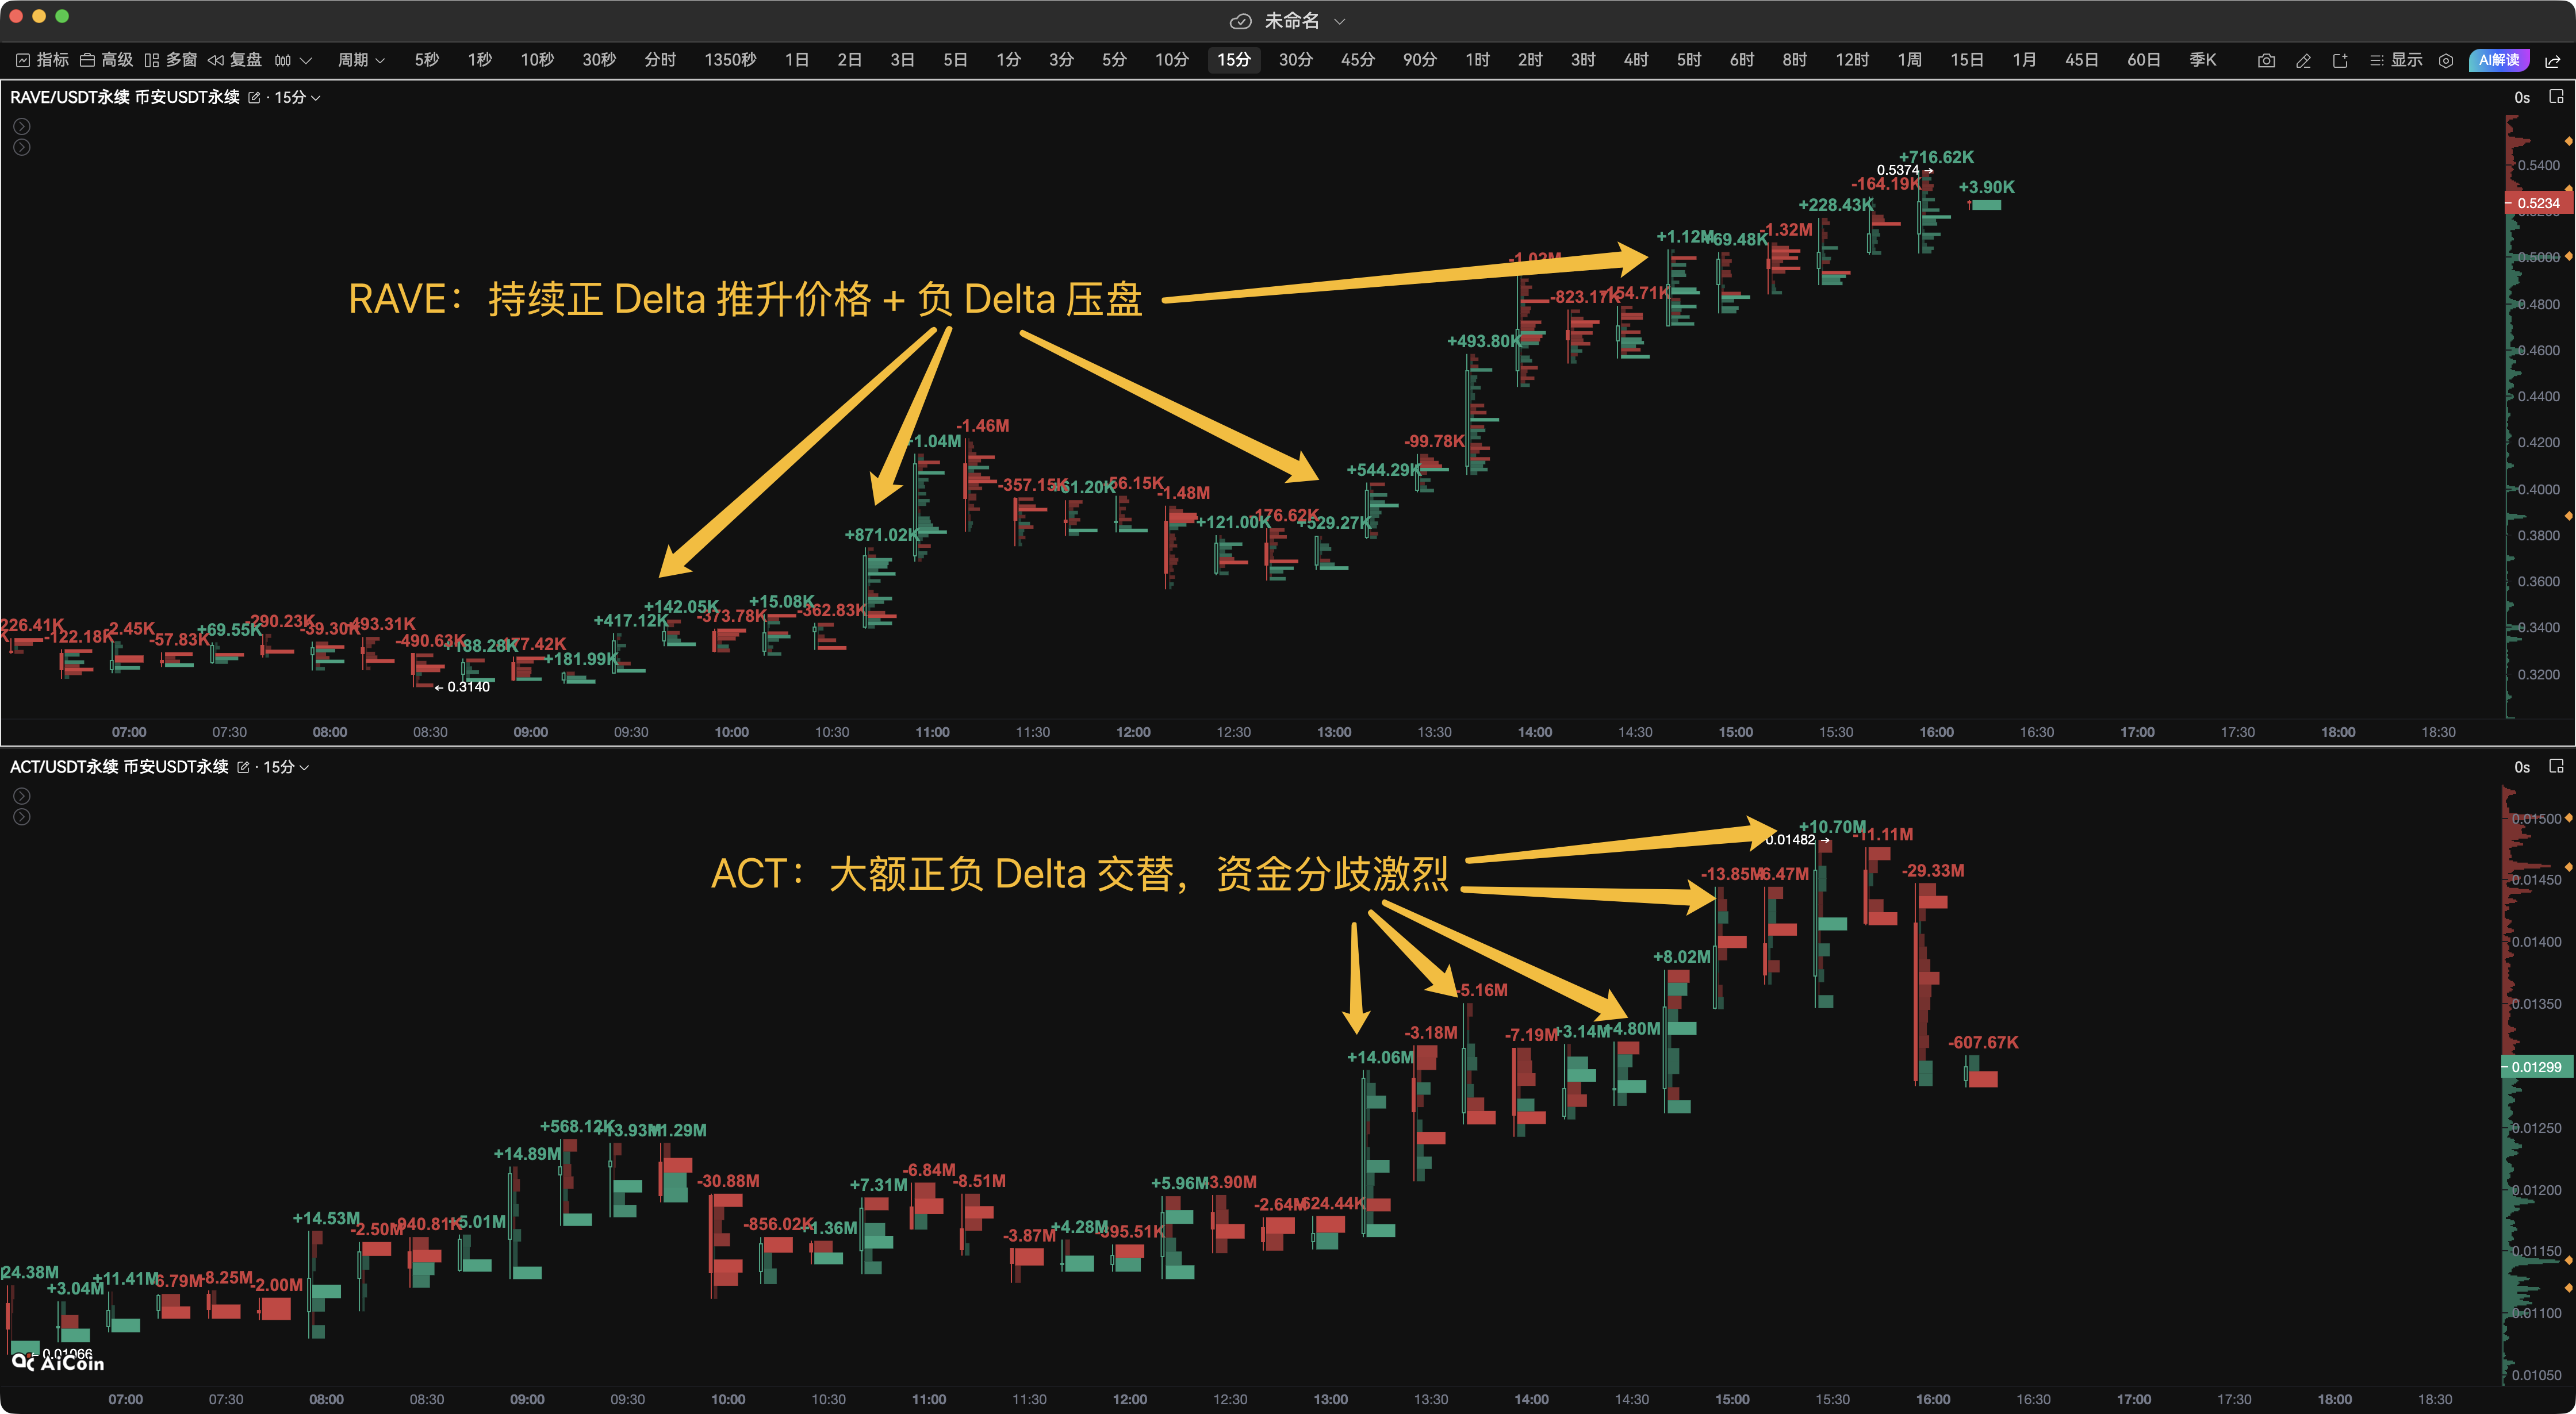
In the past 24 hours, RAVE and ACT have risen violently, but from the "footprint chart", the market is not a "brainless bull". -RAVE: During the upward trend, positive Delta values such as+871K and+1.04M appeared multiple times, indicating that active buying continues to enter the market, not just passive hanging orders to support prices; However, the presence of negative Delta values such as -1.46M and -1.48M at high levels indicates that selling is beginning to intensify, and the current trend is more like high-level digestion after a strong trend. -ACT: The upward trend is more rapid, with large positive and negative deltas such as+14.06M and -13.85M appearing at the top, indicating a more intense divergence of funds. It is not simply a healthy upward attack, and the key to the future depends on whether new active buying orders can take over. This is the value of a footprint map: it not only looks at the rise and fall of prices, but also sees clearly whether the price is driven by real capital push or a high-level reversal; Where there is acceptance, where there is selling pressure. The hot currency market runs fast, but if you take a step slower, it's easy to catch up in the divergence zone. Open AiCoin PRO and use the "Footprint Map" to see the real transactions behind each wave of rally, and track market buying and selling signals in real-time.