Loading...
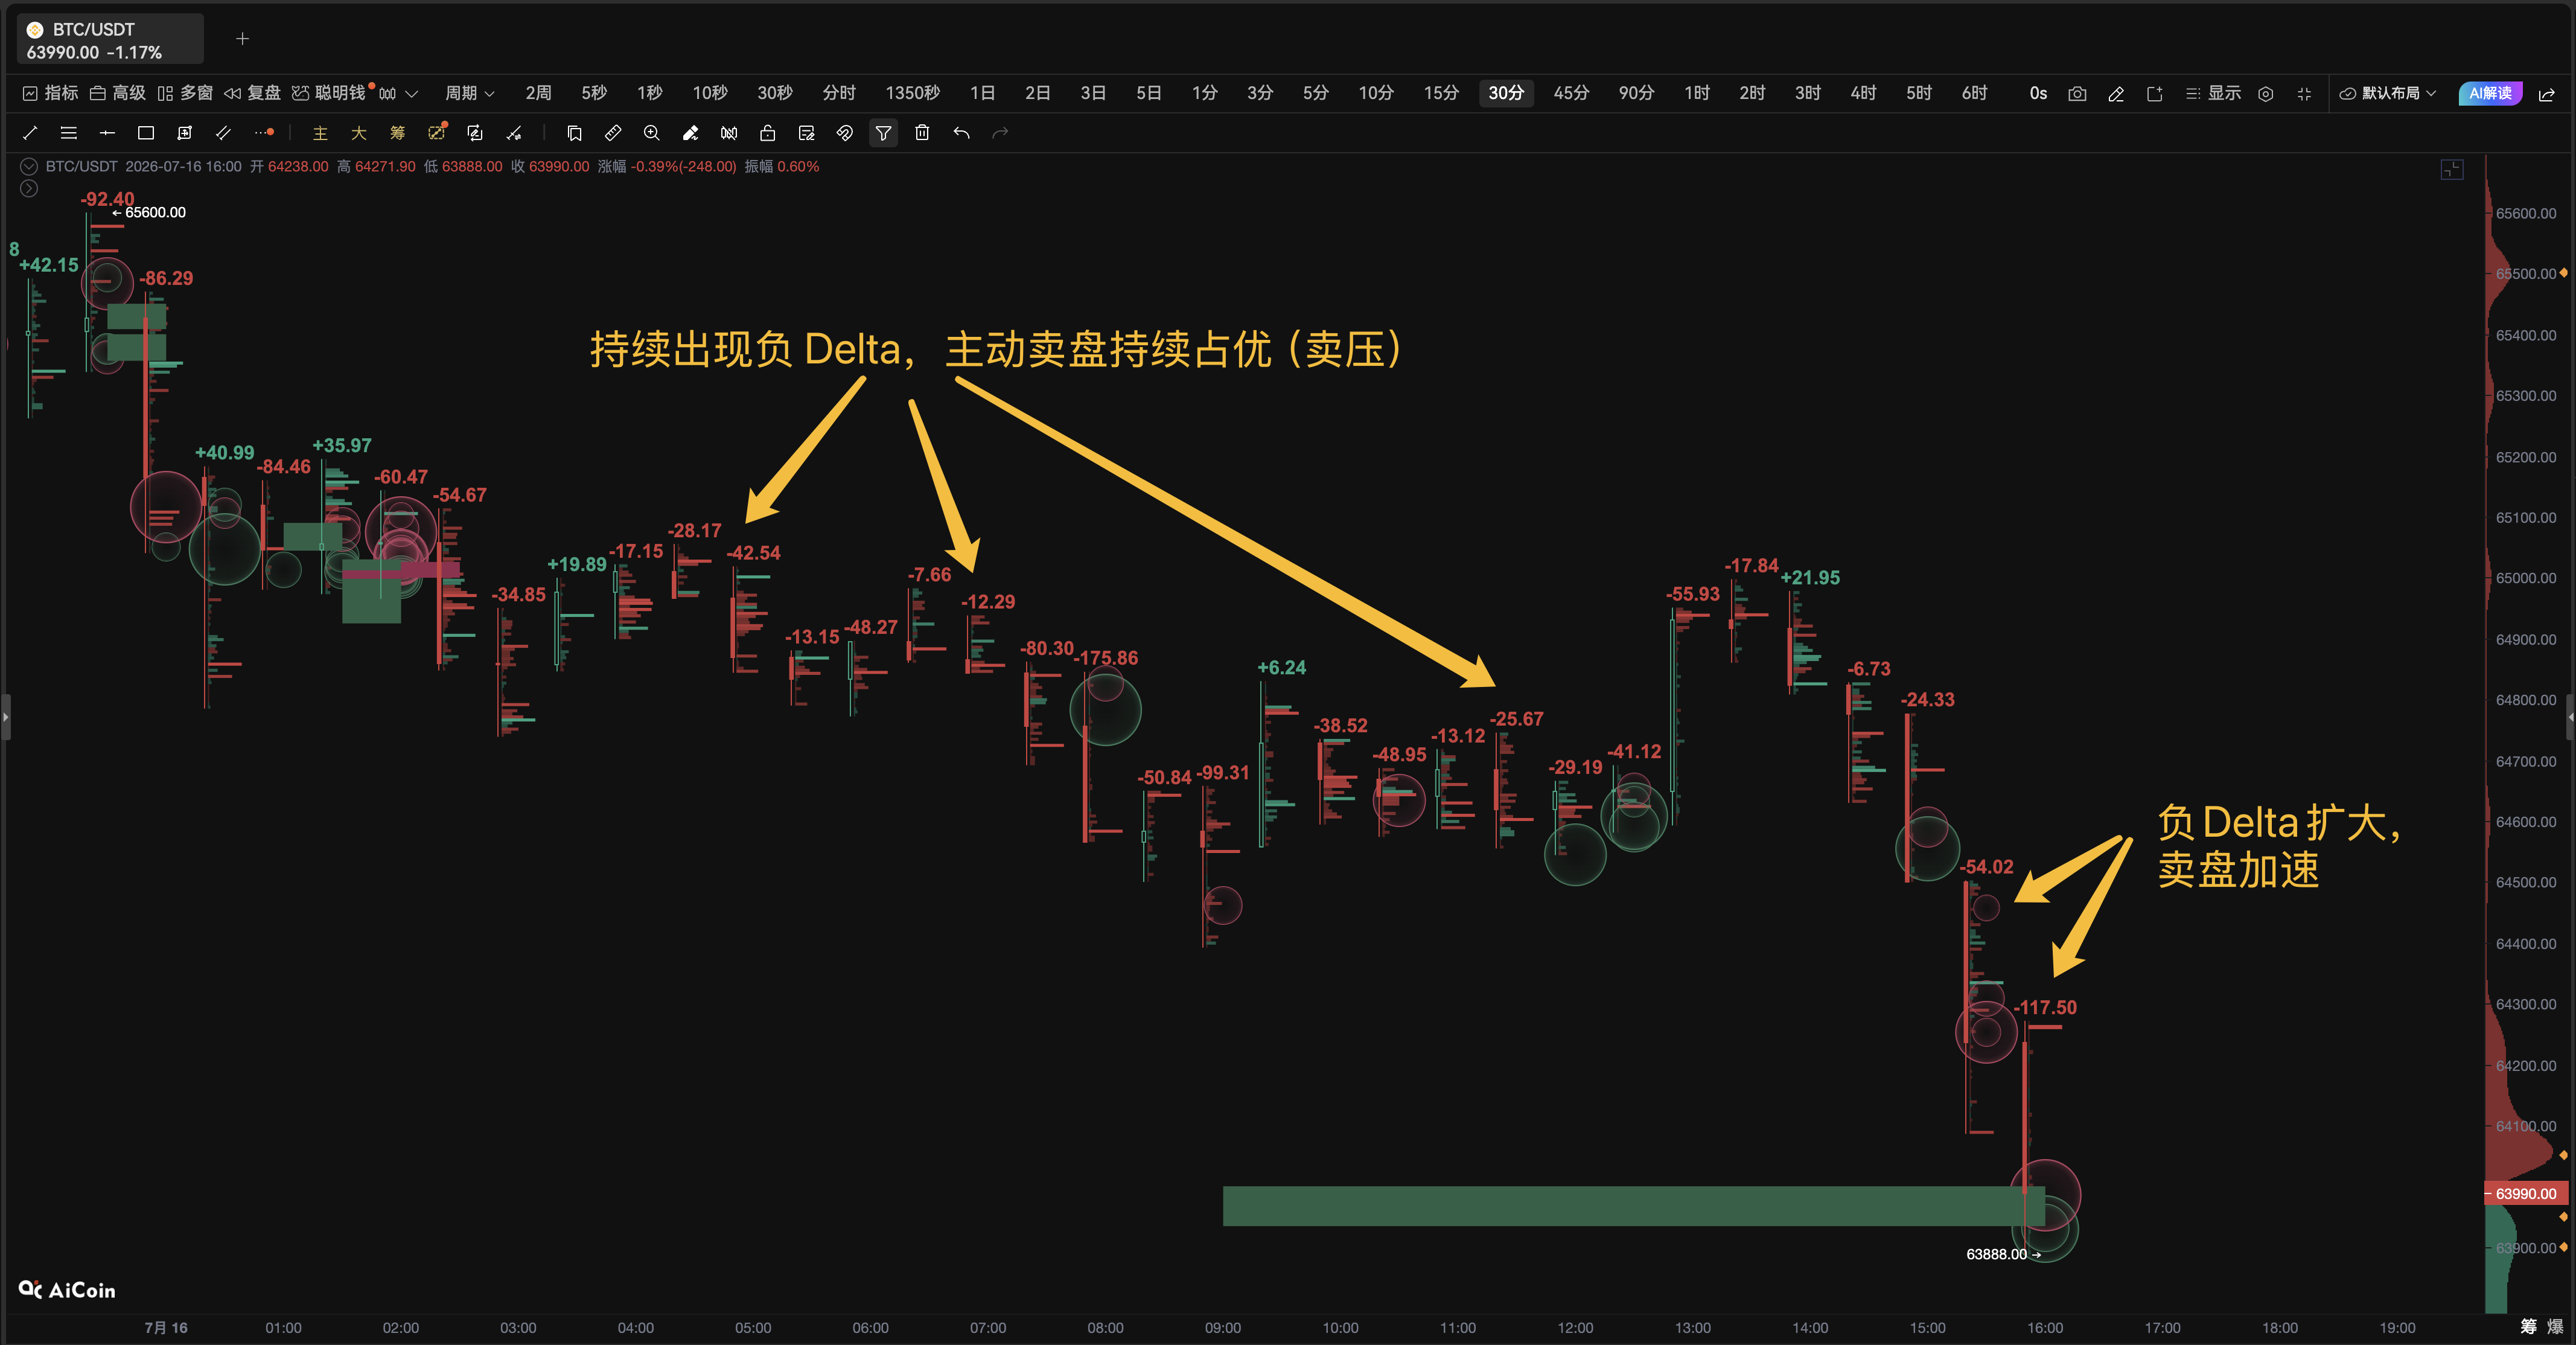
After rebounding to around $65600, BTC failed to stabilize, and the 30 minute footprint chart showed consecutive negative Delta (sellers actively smashing the market). Recently, the two prices have further expanded to -54.02 and -117.50, and the price immediately fell below $64000. This is not simply a lack of buying orders, but a continuous push of active selling orders towards the market, gradually depleting the ability to take on buying orders. Although there was a brief positive Delta (active buying counterattack) during the period, it did not drive the price to continue rebounding, indicating that the buyer's counterattack was limited. Next, we can focus on: $63940, which was the peak of the chip breakthrough in the previous round. -If the price quickly recovers and the positive Delta amplifies, it indicates that the low-level acceptance has begun to take effect; -If the position is lost and the negative Delta continues to expand, attention should be paid to the most densely traded price of chips in the past month below. The K-line can only tell you that BTC has fallen below; The PRO "Footprint Map" can show who broke it and when the selling pressure began to weaken. Don't rush to guess the bottom in the short term, wait for active buying to truly come back. The data is for reference only and does not constitute any investment advice.